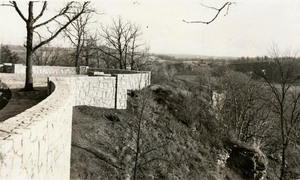
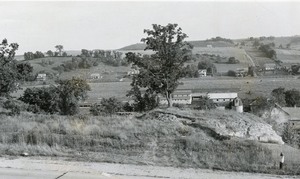
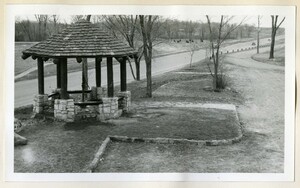
This photograph shows what Preston Overlook looked like before construction began. This picture was likely taken in the 1930s, before construction began in 1937.
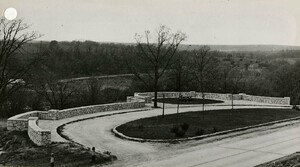
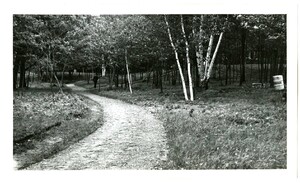
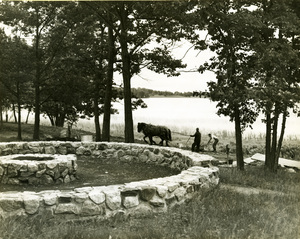
This photograph shows two construction workers and two horses during the construction of Pine-Hickory Lakes Roadside Parking Area, circa the late 1930's.
This report contains the 1974 tabulation and summary of highway speed trends at 15 various locations scattered throughout Minnesota.
Speed data shown in this report was obtained under the most ideal weather and road conditions. Also, the study site characteristics are better than average and tend to yield higher than average speed performance.
Sample sizes of bus speeds were so small that few conclusions could be drawn from them. Calculations were not performed on any sample of less than 1Q.
This report contains the 1973 tabulation and summary of highway speed trends at 15 various locations scattered throughout Minnesota.
Speed data shown in this report was obtained under the most ideal weather and road conditions. Also, the study site characteristics are better than average and tend to yield higher than average speed performance.
Sample sizes of bus speeds were so small that few conclusions could be drawn from them. Calculations were not performed on any sample of less than 10
This report presents tabulations of types of vehicles and weights of trucks found at various locations on State-Trunk Highways during the years 1973, 1974 and 1975. Data processing errors found on the 1973 and 1974 data delayed publishing the 1974 report and invalidated much of the previously published 1973 report; hence, a three year report is required.
This report is also being published while the Department is in the midst of updating both the vehicle type and truck weight programs to make them more user oriented and economical. Therefore, this report reflects some of the changes being made (elimination of truck interview and dimensions data, additional graphs), while future reports, to be prepared biennially, are expected to be even more usable and comprehensive.