Freight Performance Measure Systems (FPMS) System Evaluation and Data Analysis

Image
Creator
Date Created
2008-01
Description
One of the key measures of freight performance along interstate corridors in the United States is the average speed of travel. This report documents the findings and analysis of the ATRI Freight Performance Measure (FPM) database systems and investigates a potential FPM system design that can efficiently and effectively processes more and larger Automatic Vehicle Location (AVL) datasets collected from various trucking companies. The current FPM system at ATRI was evolved from its previous system based on GIS software. The averaged speed calculations resulting from the data process of each FPM system are somewhat different. Analysis of the average speed calculation and investigation of speed differences are discussed in chapter one. FPM database system analysis and comparison are included in chapter two. The final chapter presents an ideal FPM system and requirements needed for migration.

Appendices to Site/Environmental Correlations in Northeastern Minnesota

Image
Date Created
2001
Report Number
2002-10A
Description
These appendices pertain to report 2002-10: Appendix A. Known Archaeological Sites, Location Data Appendix B. Environmental Variables Considered Appendix C. Statistical Output Appendix D. Known Archaeological Sites, Environmental Data Appendix E. Random Points, Location Data, Environmental Variables and Probability Appendix F. Licenses and Permissions Appendix G. Random Points, USGS Maps Appendix H. Shovel Test Forms

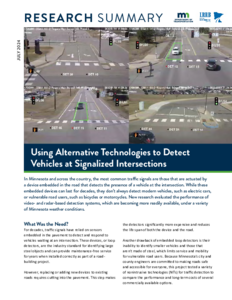
Performance Evaluation of Different Detection Technologies for Signalized Intersections in Minnesota

Image
Date Created
2024-04
Report Number
2024-10
Description
This research evaluates the performance of non-intrusive detection technologies (NITs) for traffic signals in Minnesota. Prior work shows that while no single NIT device performs best in all situations, under specific circumstances, some NIT devices consistently outperform others. Our goal in this research is to find which NIT devices perform better in conditions specific to Minnesota and provide cost estimations and maintenance recommendations for operating these devices year-round. Our research has two main components: 1)synthesizing national and local experiences procuring, deploying, and maintaining NITs, and 2) evaluating real-world NIT deployments in Minnesota across different weather conditions. Our results and analysis combine the results from these steps to make recommendations informed by research and real-world experience operating NIT devices. Through interviews with Minnesota traffic signal operators, the research finds that environmental factors like wind, snow, and rain cause most NIT failures, requiring costly on-site maintenance. Operators emphasize the need for central monitoring systems, sun shields, and heated lenses to maintain performance. The research then analyzes NIT video, signal actuation, and weather data at six Twin Cities intersections using Iteris and Autoscope Vision technologies. No single NIT performs best, aligning with previous findings, but Autoscope Vision is less prone to lens blockages requiring on-site service. Our analysis also finds some intersections have more failures, indicating location and geometry impact performance. Key recommendations are based on the relative performance of a NIT in different weather conditions and accounting for local weather conditions when selecting a NIT at an intersection. We also recommend using central monitoring systems to troubleshoot remotely, installing heat shields to prevent snow/rain accumulation, and routine annual checks and checks after major storms.

MnModel Phase 4: Project Summary and Statewide Results

Image
Date Created
2019-06
Description
The primary objective of the MnModel project is to create accurate digital maps capable of alerting planners to the presence of potential pre-contact archaeological properties in accordance with the identification requirements set forth in Section 106. By using Geographic Information Systems, digital maps are created that delineate areas of high archaeological site potential based on statistical correlations between environmental attributes and known archaeological site locations. Linking this information with maps of high and low survey coverage directs where archaeological survey efforts should be concentrated. It also assists planners in avoiding areas that potentially contain cultural resources requiring costly mitigation or in weighing the cost of their disturbance against other project effects, such as wetland disturbance or socioeconomic impacts. This approach permits planners to conduct advance planning and base decisions on sound scientific findings.

Statistical Methods for Mn/Model Phase 4

Image
Date Created
2007-08
Description
Mn/Model is a project that combines landscape and archaeological databases in a Geographic Information System (GIS) with statistical prediction methods to provide an estimate of the risk that a given location contains archaeological artifacts. Planners use these estimates both to seek out areas of low risk and to accommodate areas of high risk when planning transportation projects. Obviously, more accurate risk estimates lead to improved planning and reduced costs. Mn/Model is about to move into its fourth phase, which will include improved landscape and archaeological data. At this time, Mn/DOT wishes to reconsider the statistical prediction methods used in Phase 3 to determine if better alternatives are available. This project proposed and compared eight prediction methods, the Phase 3 method and seven alternatives. The methods were logistic regression with BIC model selection (the Phase 3 approach), logistic regression with Bayesian model averaging, naïve Bayes classification, tree-structured regression, "bumped" trees, "bagged" trees, "double bagged" trees, and "boosted" trees. Bumping, bagging, and boosting are examples of "perturb and aggregate methods," which repeatedly modify the data in minor ways and then combine the predictions from the modified data sets. Overall, bagging, double bagging, and boosting had the best predictive ability. We recommend that bagged trees, or bagging, be the default prediction method for Phase 4. Bagging is easier to do in S-Plus (the statistical software used) than boosting and easier to implement in the GIS framework. Bagging provides substantial improvement in predictive capability over the Phase 3 method. Tree-structured models are also fairly easy to explain to the general public. Double bagging provides a small improvement over bagging, but at the cost of substantially more effort in implementation.

Current State of the Art and Practice of Using Ground Penetrating Radar (GPR) for Minnesota Roadway Applications

Image
Creator
Date Created
2005-11
Description
Ground penetrating radar (GPR) is a noninvasive, continuous, high-speed tool that has been used to map subsurface conditions in a wide variety of applications. Many of these applications are well suited for evaluation of highway systems. GPR is basically a subsurface "anomaly" detector, as such it will map changes in the underground profile due to contrasts in the electromagnetic conductivity across material interfaces. This report will give the local engineer a brief overview of GPR equipment, use and applications. It will help the engineer understand the potential GPR applications for use on local roads, assist in determining what situations or site conditions that GPR is appropriate, and where it is not.