Displaying results 1 - 10 of 12

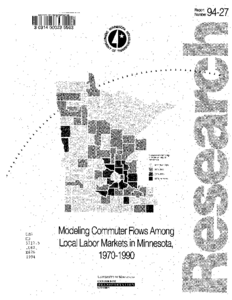
Modeling Commuter Flows Among Local Labor Markets in Minnesota, 1970-1990
Image
Date Created
1994
Report Number
94-27
Description
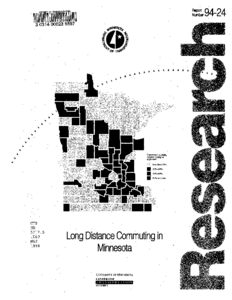
Long Distance Commuting in Minnesota
Image
Date Created
1994
Report Number
94-24
Description
Transportation-based classifications of Minnesota's counties and metropolitan statistical area tracts using measures from the 1990 Census of Population and Housing: Final Report
Image

Date Created
1994
Report Number
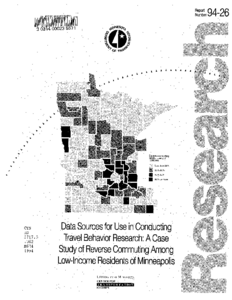
94-25
Description
Data sources for use in conducting travel behavior research : a case study of reverse commuting among low-income residents of Minneapolis: Final Report
Image
Date Created
1994
Report Number
94-26
Description


Commuter Bicyclist Behavior and Facility Disruption
Image

Creator
Date Created
2007
Report Number
2007-15
Description
