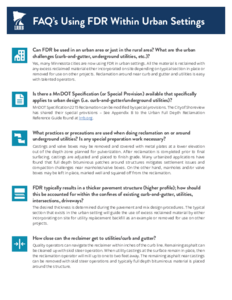
Generational Perspective on Teen and Older Drivers on Traffic Safety in Rural and Urban Communities (Technical Summary)

Image
Date Created
2008
Report Number
2008-36TS
Description
A 2002 National Safety Council report indicates that road traffic injuries are the most common cause of death in the United States for all age groups up to 75 years, with the rate of fatal crashes higher in rural areas. Teen, young adult and senior drivers have the highest fatality rates. Research further indicates that most crashes are the result of driver impairment or high-risk driving behavior.

Full Depth Reclamation Resource Guide for Urban and Suburban Street Application

Image
Creator
Date Created
2021-06
Report Number
2021RIC02
Description
Full-depth reclamation (FDR), a common strategy on rural roadways to reduce costs for materials and hauling, was validated to be a viable long-term and cost-effective option for urban and suburban asphalt pavement rehabilitation. These findings were published in two Minnesota Local Road Research Board studies from 2016. However, statewide application of Urban FDR is yet to be attained in Minnesota or widely adopted by city and county public works departments. To help cities and counties determine feasibility, the Minnesota Local Road Research Board developed informational materials on how to conduct Full-Depth Reclamation (FDR) within urban areas (i.e. curb-and-gutter, utilities, storm sewers, manholes, etc.). Topics include: •Basic Overview of FDR •FDR Candidate – What to Consider •Specification/Construction Inspection •Cost This report has two appendices.

Enhancement and Application of the Minnesota Dry Swale Calculator

Image
Date Created
2016
Report Number
2016-15
Description
Roadside drainage ditches (roadside grassed swales) typically receive runoff directly from the road and water is infiltrated over the side slope of the ditch, similar to a filter strip. Water that runs off the side slopes then has a further opportunity to infiltrate as it flows down the center of the ditch. This research focuses on the volume reduction performance of grassed drainage ditches or swales by infiltration. A total of 32 tests were performed during three seasons in four different highways maintained by MnDOT in the Twin Cities metro area. The field-measured saturated hydraulic conductivities (Ksat) correspond to hydrologic soil group A, even though the soil textures indicated correspondence to hydrologic soils groups A, B and C. This means that the infiltration performance is better than expected for these types of soils. In addition, the trend was to have more infiltration when the saturated hydraulic conductivity was higher and for a greater side slope length, as expected. A coupled overland flow-infiltration model that accounts for shallow concentrated flow has been developed. The predicted infiltration loss has been compared with the actual infiltration loss determined from the monitored field tests. In this manner, the validity of the model as well as the associated soil hydraulic and surface geometry parameters have been evaluated. Using the coupled infiltration-overland flow model, multiple scenarios with sensitivity analyses have been computed, and the results have been used to generate a simplified calculator to estimate the annual infiltration performance of a grassed roadside drainage ditch.

Determination of Effective Impervious Area in Urban Watersheds

Image
Date Created
2015
Report Number
2015-41
Description
Impervious surfaces have been identified as an indicator of the impacts of urbanization on water resources. The design of stormwater control measures is often performed using the total impervious area (TIA) in a watershed. Recent studies have shown that a better parameter for these designs is the "effective" impervious area (EIA), or the portion of total impervious area that is hydraulically connected to the storm sewer system. Methods to improve estimates of EIA are not highly researched, and need further investigation. The overall goal of this project is to develop a method to estimate EIA in urban watersheds with data that is readily available. First, the existing rainfall-runoff method was improved by reducing the uncertainty associated with EIA estimates and applying it to 40 gauged urban watersheds with different sizes and hydrologic conditions, mostly in the Twin Cities metro area of MN and Austin, TX. The results are then utilized to develop a new method based on the integration of GIS and Curve Number (CN). The GIS-CN method is applicable to un-gauged watersheds and is able to estimate EIA fraction based on TIA and hydrologic soil group (HSG). The results are used to evaluate the potential and the limitations of the GIS-CN method. The outcome and applications of this study improves the rainfall-runoff modelling in urban watersheds and will eventually lead to the design of a more sustainable urban stormwater infrastructure.

Travel Behavior Over Time

Image
Date Created
2015
Report Number
2015-23
Description
Using detailed travel surveys (the Travel Behavior Inventory) conducted by the Metropolitan Council of the Minneapolis/Saint Paul (Twin Cities) Region in Minnesota for 1990, 2000-2001, and 2010-2011, this report conducts an analysis of changes in travel behavior over time. Specifically looking at changes in travel duration, time, use, and accessibility; telecommuting and its relationship with travel and residential choices; transit service quality and transit use; effects of age and cohort; and changes in walking and bicycling. Much has changed in this period, including the size of the region, demographics, economics, technology, driver licensing, and preferences, examining in turn the effects of investment, development, and population change on behaviors for the Minneapolis-St. Paul region as a whole and for areas within the region. While this research cannot hope to untangle all of the contributing factors, it aims to increase understanding of what did happen, with some explanation of why. This will inform transportation engineers, planners, economists, analysts, and decision makers about the prospective effects of future changes to networks, land use, and demographics while also evaluating the effects of previous network investments.

Access to Destinations: Annual Accessibility Measure for the Twin Cities Metropolitan Area

Image
Date Created
2012
Report Number
2012-34
Description
Report #13 in the series: Access to Destinations Study. This report summarizes previous phases of the Access to Destinations project and applies the techniques developed over the course of the project to conduct an evaluation of accessibility in the Twin Cities for 2010. It also describes a methodology that can be used to implement future evaluations of accessibility.

Using Twin Cities Destinations and Their Accessibility as a Multimodal Planning Tool: Task 5 Report

Image
Date Created
2012
Report Number
2012-05
Description
This study uses accessibility as a performance measure to evaluate a matrix of future land use and network scenarios for planning purposes. Previous research has established the coevolution of transportation and land use, demonstrated the dependence of accessibility on both, and made the case for the use of accessibility measures as a planning tool. This study builds off of these findings by demonstrating the use of accessibility-based performance measures on the Twin Cities metropolitan area. This choice of performance measure also allows for transit and highway networks to be compared side-by-side. A zone-to-zone travel time matrix was computed using Stochastic User Equilibrium (SUE) assignment with travel time feedback to trip distribution. A database of schedules was used on the transit networks to assign transit routes. This travel time data was joined with the land use data from each scenario to obtain the employment, population, and labor accessibility from each traffic analysis zone (TAZ) within specified time ranges. Tables of person-weighed accessibility were computed for 20 minutes with zone population as the weight for employment accessibility and zone employment as the weight for population and labor accessibility. The person-weighted accessibility results were then used to evaluate the planning scenarios. The results show that centralized population and employment produce the highest accessibility across all networks.

Access to Destinations: Arterial Data Acquisition and Network-Wide Travel Time Estimation (Phase II)

Image
Date Created
2010
Report Number
2010-12
Description
Report #10 in the series: Access to Destinations Study. The objectives of this project were to (a) produce historic estimates of travel times on Twin-Cities arterials for 1995 and 2005, and (b) develop an initial architecture and database that could, in the future, produce timely estimates of arterial traffic volumes and travel times. Our Phase I field study indicated that on arterial links where both the demand traffic volume and the signal timing are known, model-based estimates of travel time that are on average within 10% of measured values can be obtained. Phase II of this project then focused on applying this approach to the entire Twin Cities arterial system. The Phase II effort divided into three main subtasks: (1) updating estimates of demand traffic volume obtained from a transportation planning model to make them consistent with available volume measurements, (2) collecting information on traffic signal locations in the Twin Cities and compiling this into a geographic database, and (3) combining the updated traffic volumes and signal information to produce link-by-link peak-period travel time estimates. The traffic volume update took as inputs the predicted volumes generated by a traffic assignment model and measured average annual daily traffic from automatic traffic recorders, and gave as output updated estimates of the traffic volumes for links lacking automatic traffic recorders. A request to state, county and municipal agencies in the seven-county metro area produced Information on approximately 2,900 traffic signals. Estimated arterial travel times for the morning and afternoon peak periods for 1995 and 2005 were then computed and sent to other components of the Access to Destinations effort.