Displaying results 1 - 25 of 60

Linking Light Rail Transit to the City: Six Neighborhood Station Districts
Image

Creator
Date Created
1999
Report Number
2000-01
Description
Minnesota Transit Laboratory: Phase I Conclusions: Improving Transit Service
Image
Date Created
1989-07
Report Number
89-21
Description
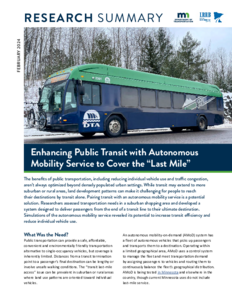
Designing an Autonomous Service to Cover Transit’s Last Mile in Low-Density Areas
Image
Date Created
2024-04
Report Number
2024-06
Description
Impact of Transitways on Travel on Parallel and Adjacent Roads and Park-and-Ride Facilities
Image

Date Created
2021
Report Number
2021-03
Description
After Study of The Bus Rapid Transit A Line Impacts
Image

Creator
Date Created
2018
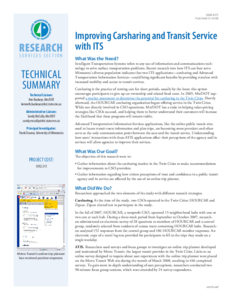
Report Number
2018-35
Description
Improving Carsharing and Transit Service with ITS
Image

Date Created
2008
Report Number
2008-43
Description
Mitigating Highway Construction Impacts with Transit
Image

Date Created
2012
Report Number
TRS1205
Description

Light Rail Train 2004
Image

Date Created
2004


