Displaying results 1 - 10 of 13
Results per page
10
25
50

Transit System Monitoring and Design

Image
Date Created
1990
Report Number
94-17
Description
Statistical techniques were developed for extracting the most significant features (indicators) from a transit system data base, and classifying proposed and existing transit systems according to the selected features. The data base was constructed by using information from all previous years available by the Mn/DOT, the Census and other sources to be used in classifying transit systems. The data base emphasized the use of raw characteristics of the operating system and the area socioeconomics. The feature extraction was done so that the minimum number of features were extracted that can be used for classifying the transit systems with maximum accuracy. The classification method was designed around the data base and is flexible so that it can use future data to update the data base at minimum cost. The transit system patterns, resulting from the classification method, were identified according to need and performance, and the main characteristics were specified for each pattern. These characteristics and descriptions identifying each pattern determines whether it should be modified. A controlled experiment was required to test the classification method. A randomly selected part of the data was classified by the method, and then the unselected data was treated as a control group for the experiment. After the experiment a percent of misclassifications was calculated

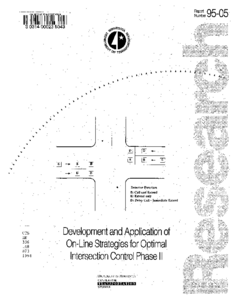
Development and Application of On-Line Strategies for Optimal Intersection Control Phase II

Image
Date Created
1994-10
Report Number
95-05
Description
This project evaluates various intersection control strategies in a simulated environment and also helped establish a live laboratory for use in future testing of new control strategies. The report reviews major intersection control strategies, including the state-of-the-art strategies with adaptive and on-line timing generation features. In addition, it details simulation results for the OPAC control strategy. The NETSIM simulator created the simulation environment for a test network that included part of downtown Minneapolis. Comparison results indicate that OPAC performs best with low-traffic demands, and pretimed control was the most effective during peak periods when traffic demand reached capacity. In conjunction with this project, Minneapolis city traffic engineers installed a machine-vision video detection system at a live intersection laboratory. Located at Franklin and Lyndale Avenues, the test site will help researchers evaluate new control strategies before full-scale implementation in later phases of this research. The Phase I report is available at https://hdl.handle.net/11299/155938.

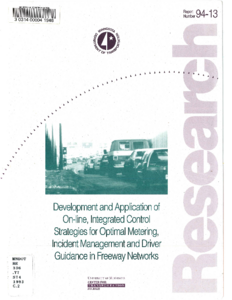
Development and Application of On-Line, Integrated Control Strategies for Optimal Metering, Incident Management and Driver Guidance in Freeway Networks

Image
Date Created
1993-04
Report Number
94-13
Description
This report summarizes the final results of the enhancement and validation of the control-emulation method in the real freeway environment. A computer-based control-emulation method that can evaluate various automatic rate-selection strategies was developed by this research team in the previous phase of this research. Software was developed that operationalizes this method for field applications. A method was developed and tested to determine the best metering thresholds for a given section of a freeway, under normal weather conditions, using the control-emulation method and the downhill simplex optimization procedure. The method finds the optimal thresholds for each ramp in a given. section of the freeway by considering the system-wide traffic conditions. An independent procedure to determine the initial thresholds that can be used to initialize the optimization process was also developed. A preliminary study for developing an on-line predictor for freeway exit demand was performed and an adaptive prediction procedure was developed. The prediction model formulated in this research used historical demand and current day measurements. Further, the parameters in the prediction model are updated in real time using the Extended Kalman Filter, so that the propagation of prediction error can be minimized.

Transportation and Economic Development: Final Report

Image
Date Created
1989-05
Report Number
89-11
Description
A time series methodology is developed that differentiates the effects of highways on development from the effects of development on highways. This methodology uses pooled time-series and cross-sectional data on highway expenditures and county employment for the 87 Minnesota counties and all 9 economic sectors over the 25-year period 1957-1982 and includes classification of counties based on access, demographic and socioeconomic features. Results from vector autoregressions are tested against modern causality tests of Granger-Sims type. In the wholesale and natural-resource-based service sectors (e.g., tourism), increased highway expenditures result in long-term employment increases. While regionally very substantial, the impacts are distributional, i.e., the statewide impact is negligible. Government role is mostly reactive, increasing funding to counties whose economy is increasing, except in rural areas where government also attempts to stimulate declining economies. Funding decisions are highly sensitive to changes in the economy, especially in rural areas, and (as our evaluation of the Minnesota Department of Transportation [Mn/DOT] project selection process indicates) are primarily influenced by the District recommendation. Further, a new B/C project selection process is developed and tested on highway weight restriction policies in Northeast Minnesota. Both simulation with large 1/0 model and comparison with actual funding decisions made independently by Mn/DOT indicate agreement with our results. An extensive literature review and 175 references are included. This report consists of nine separate publications: an executive summary, the final report and seven appendices.